Jobs
Deploying models and pipelines in Cordatus is a fast and easy process that takes just a few clicks. Each deployment is managed as an independent Job instance. Inference analytics and alarms are tracked and stored separately for each job.
Cordatus uses NVIDIA DeepStream SDK for Intelligent Video Analytics. The DeepStream version may vary between devices, and this can create small differences in Cordatus's capabilities.
Starting a New Job
The deployment process is exactly the same for ready-to-use models, custom models, and pipelines in Cordatus.
Important Notes
- You can create multiple job instances from one model or pipeline
- A job can perform inference on multiple camera streams within your device's license capacity
NOTE: Before deploying a model, ensure you have added at least one active camera and client device to Cordatus. For detailed instructions, see the Camera and Device connection sections.
Job Startup Steps
- Go to the AI Platform → AI Workflow page from the left sidebar of the Web App.
- If you want to start a job with a single model, you can select a model or go to the startup screen via the play button next to it.
- You'll be greeted with the Select a Device screen. Select which device you want to start the job on through this screen, then click the Select Device button.
- Enter the job requirements:
Requirements
| Field | Description |
|---|---|
| Job Name | Give your job a name. The job will be identified by this name in analytics screens. |
| Camera Selection | Select the camera(s) you want to start your job on. You can visit theCameras page to add cameras. |
| Model Assignment Matrix | This matrix allows you to select which model will run on which camera. This screen will only appear if you select multiple models. If you select a single model, this screen will not appear. |
| Computing Device | If your selected device is ready, you'll see theDevice Ready message on the right. |
| GPU Configuration | When you have multiple GPUs, they will be listed here. You can select which GPU you want to start this job on. |
| Add Alarm (Optional) | You can add Model-Based Alarms when starting your job. These alarms need to be defined beforehand. You can follow theAlarms page for this. |
| Schedule Job (Optional) | If you want the job to run and stop at specific times, you can schedule your job. |
- Then click the Start Job button to start the job.
First Deployment
INFO: When deploying a job for the first time on a device, the process may take time depending on the device and internet speed. During the first deployment, the client will download and install the 35GB inference engine to the device. Users can track the download progress by clicking the download icon in the upper right corner of the Client interface. Once completed, the job will start automatically.
If the model hasn't been downloaded before, Cordatus will download the model, build it, connect cameras, and start the inference process. When a job is first started, the model building and downloading model sections may take some time depending on the device and internet speed. After that, a built and downloaded model will not be built again.
NOTE: A new job can only be started from the Web App. However, you can restart, stop, or delete a job from the Client.
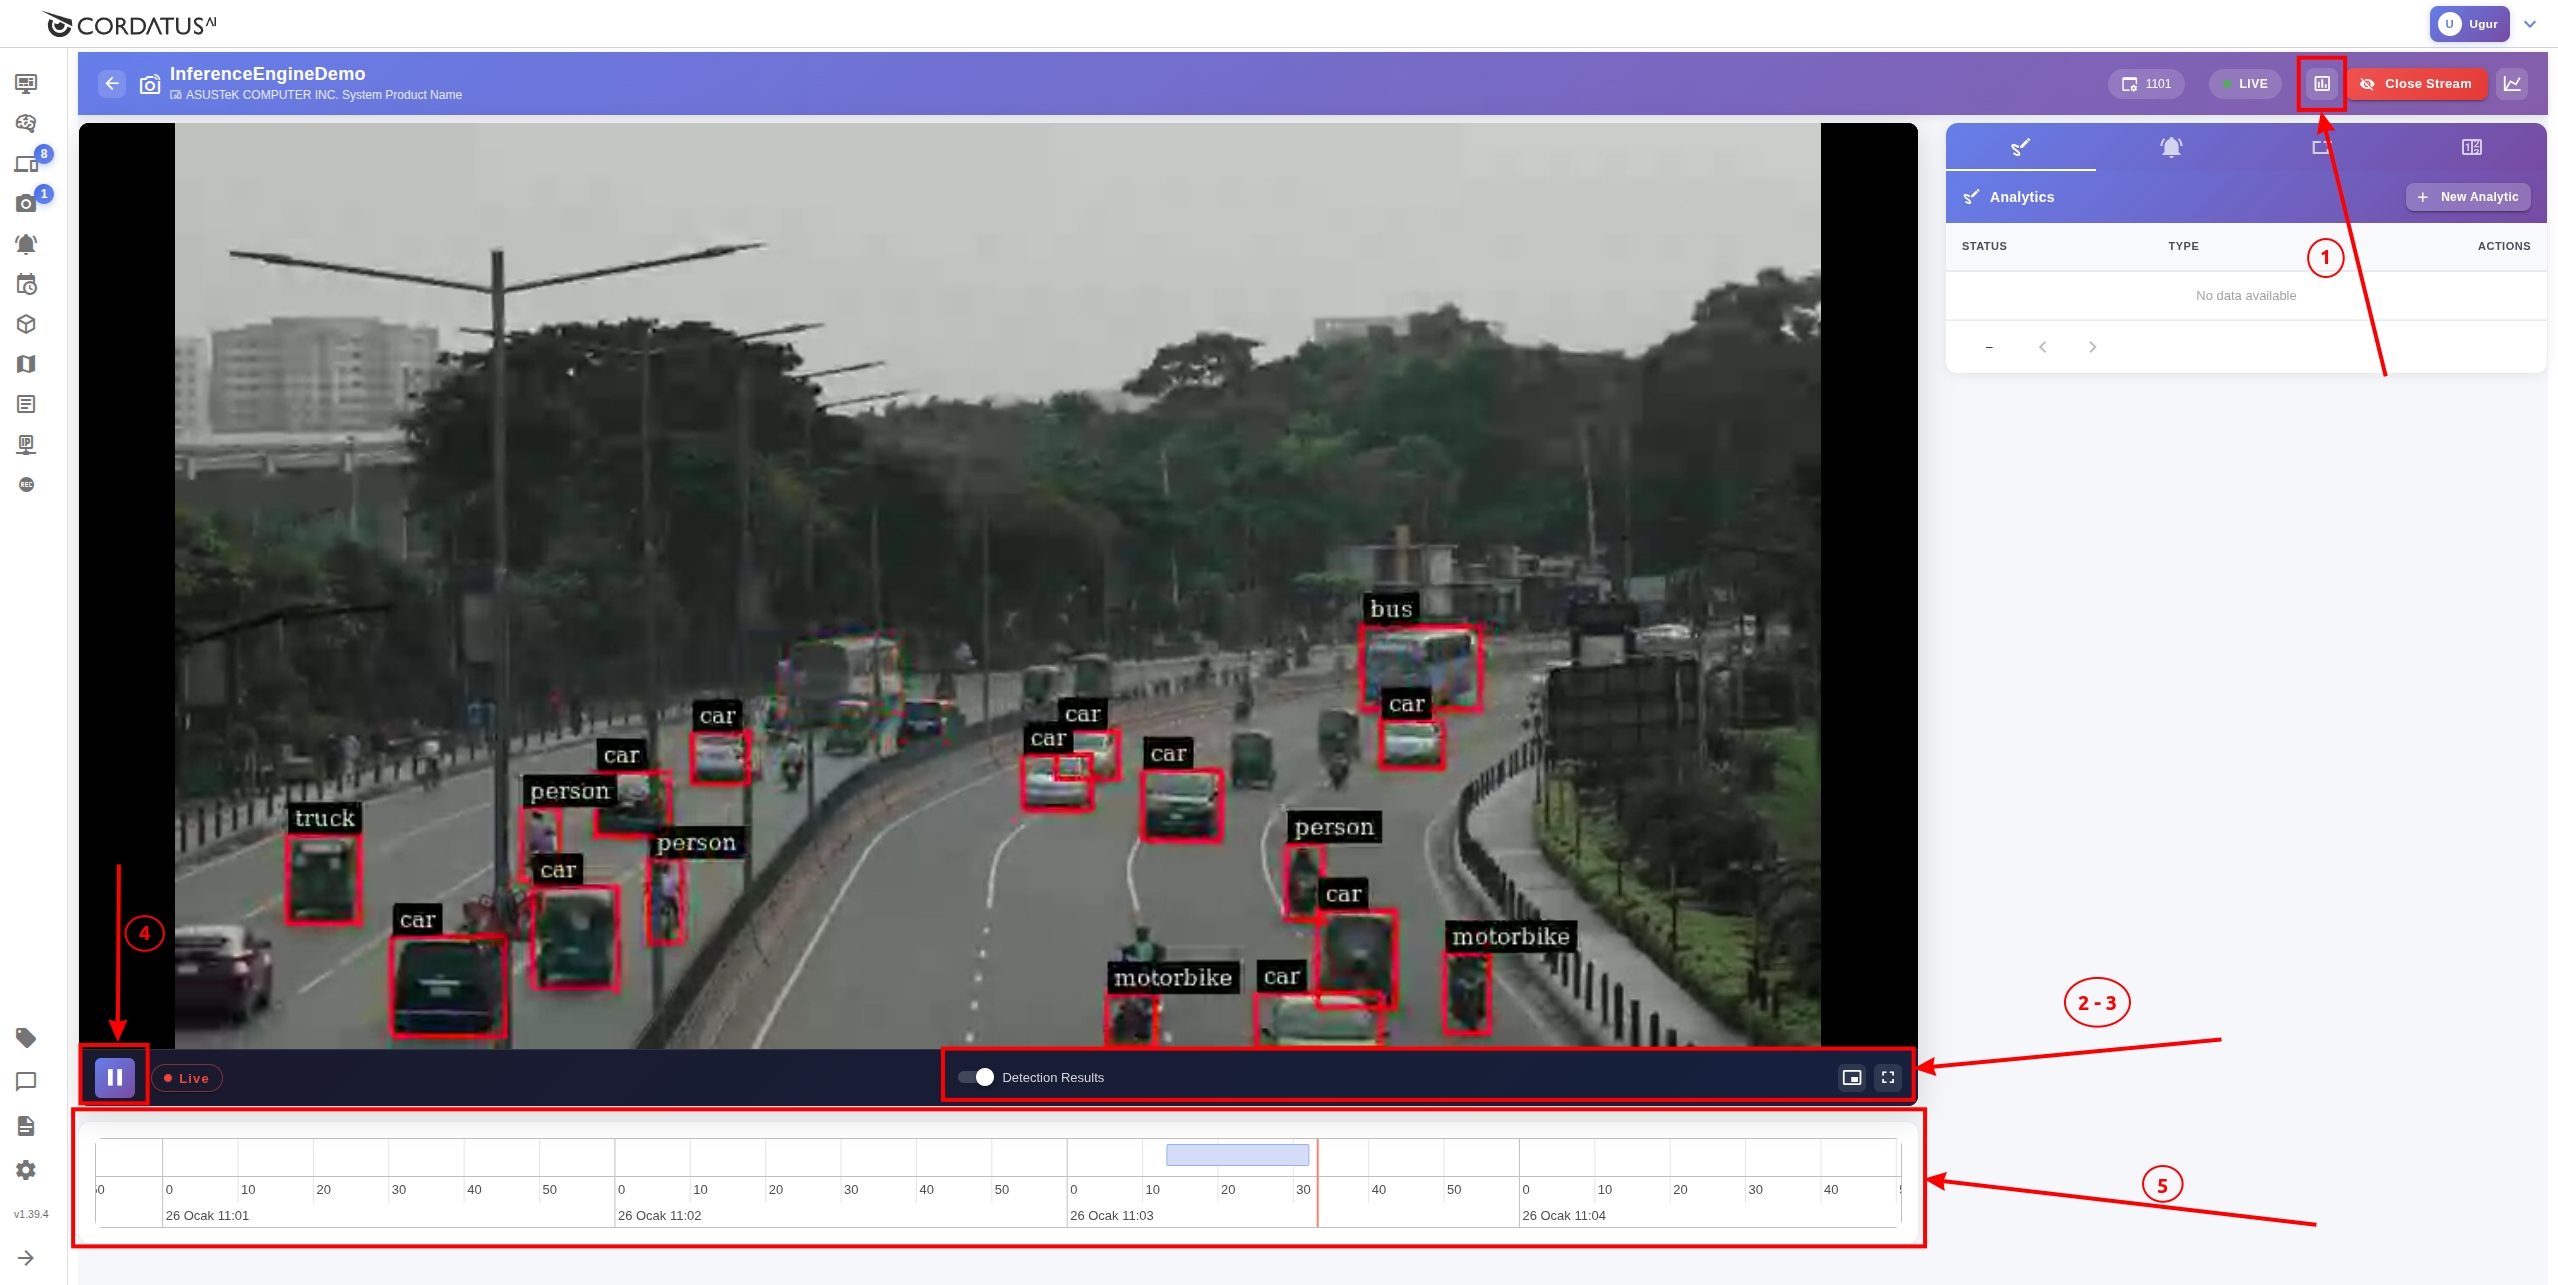
Stream Page
On the stream page, you can observe your inferred video views in real-time. Actions you can perform on this page:
- Metrics Icon (upper right): View device metrics for the inference job
- Detection Results Toggle (Center): Turn the display of inference results on/off
- View Mode (lower right): Switch between picture-in-picture and full-screen mode
- Pause/Play Icon (lower left): Stop or continue the video
- All Detections (bottom bar): View time periods when Cordatus detected objects
 Viewing a Job
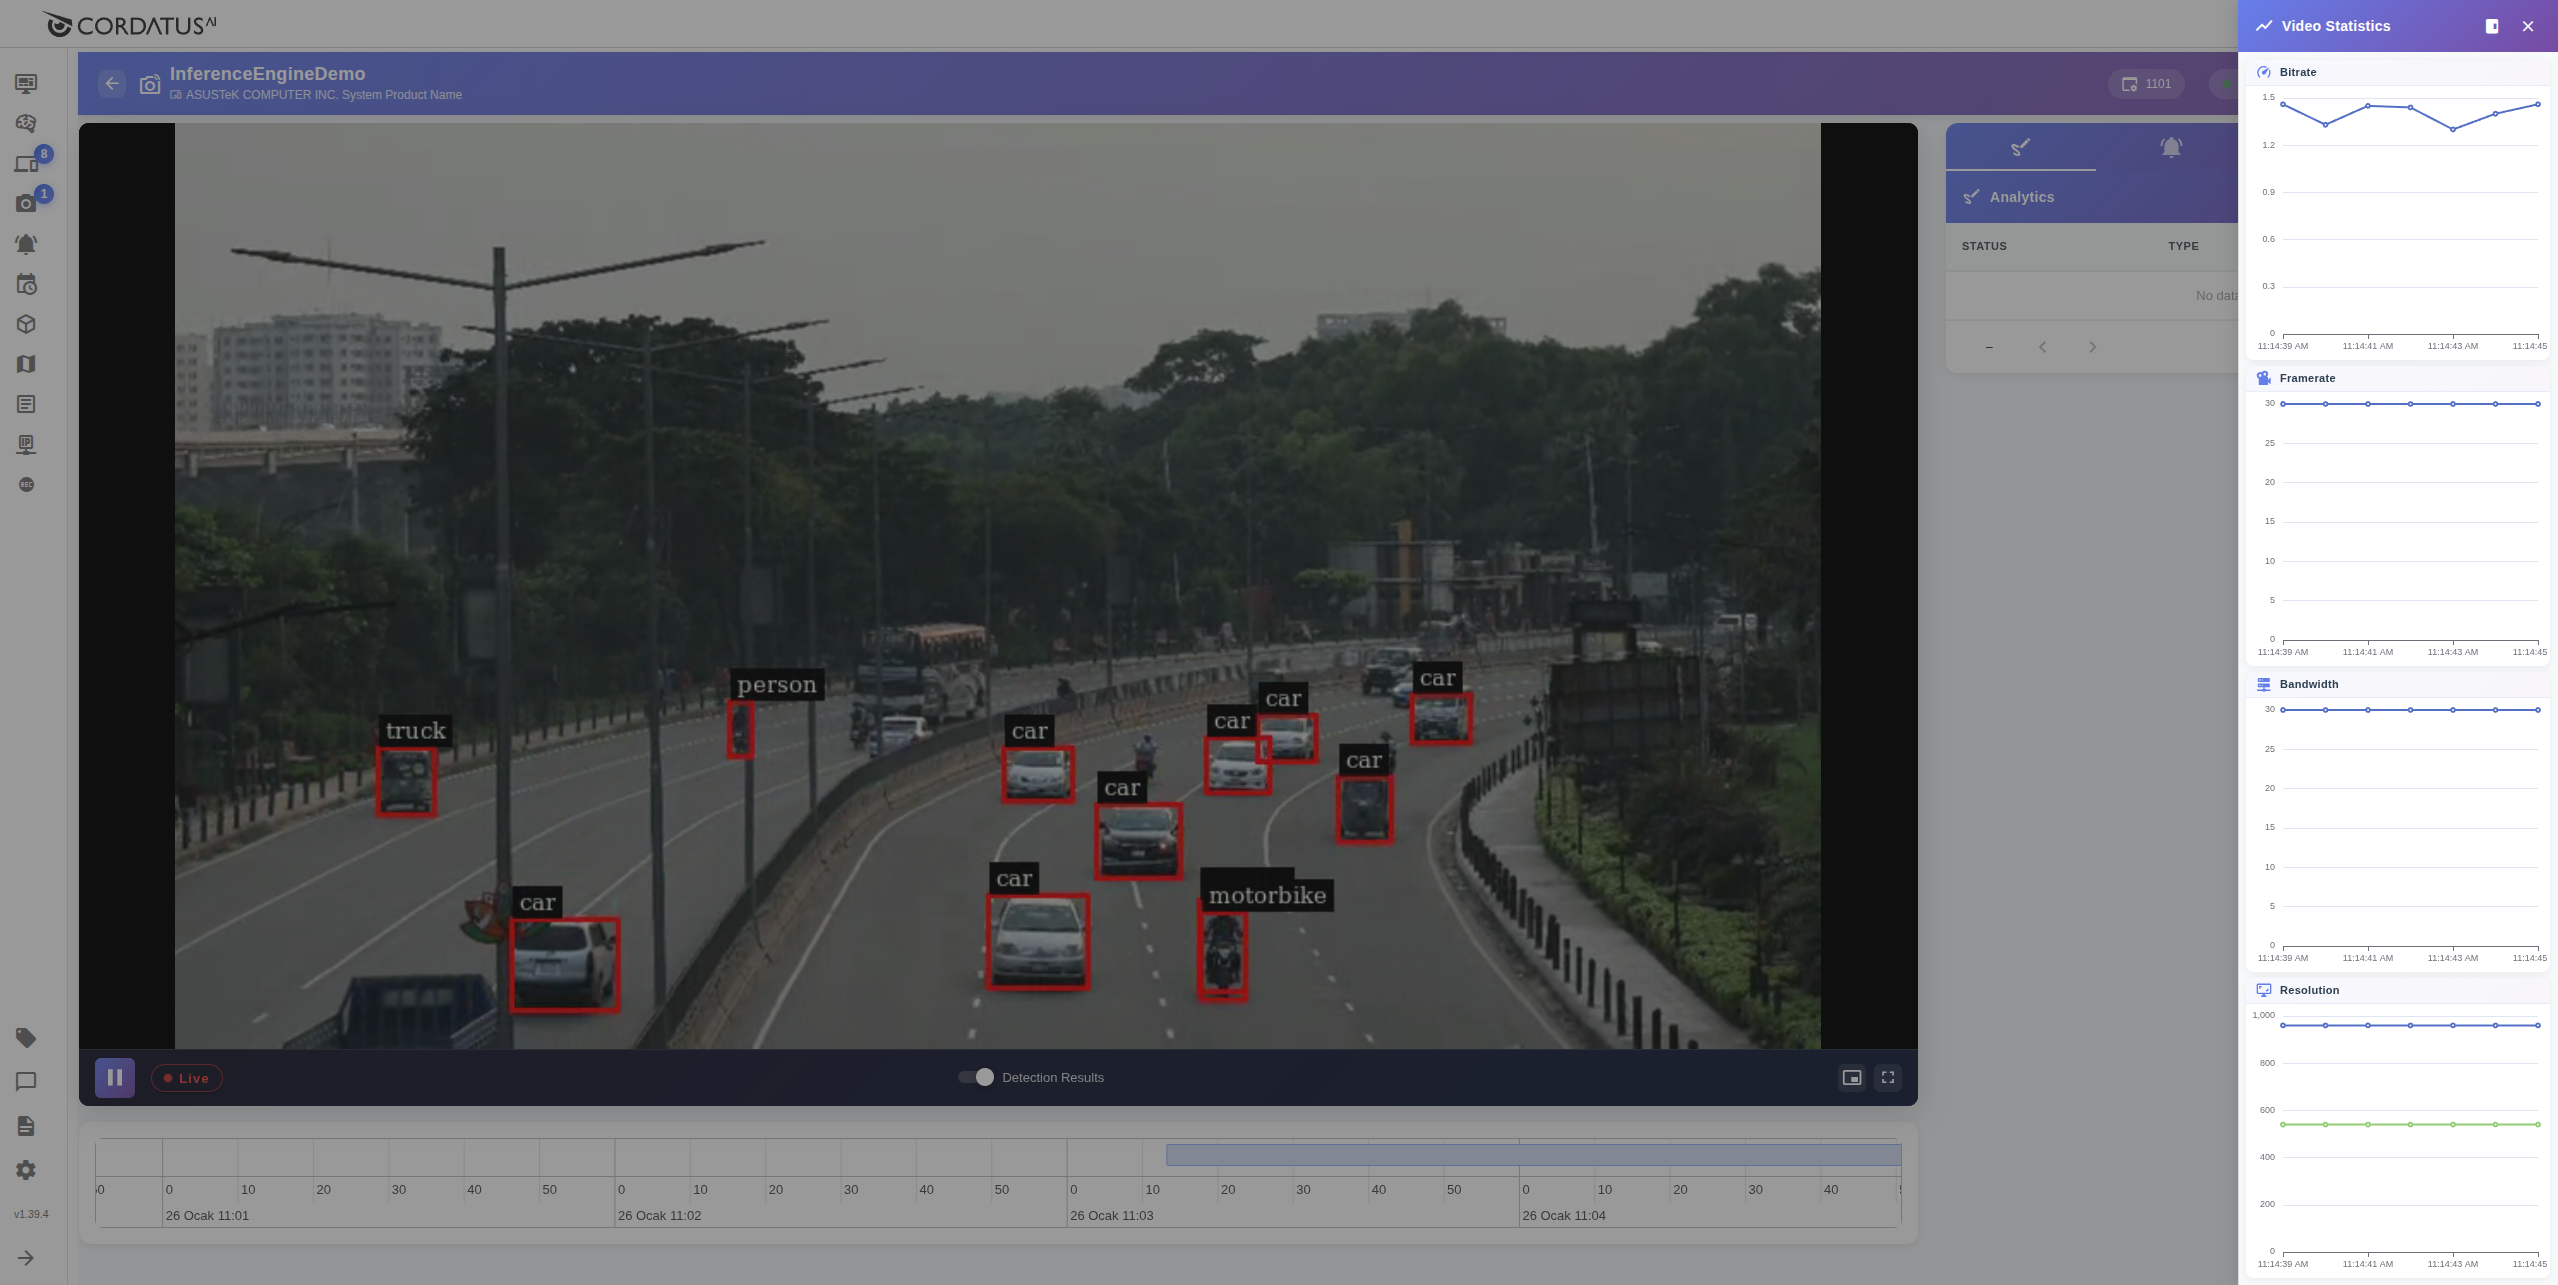
Stream Details
You can see more details about the stream by clicking the graph icon in the upper right corner of the screen. In the opened panel, you can check:
- Frame rate (FPS)
- Bitrate
- Bandwidth
- Resolution
 Stream Details
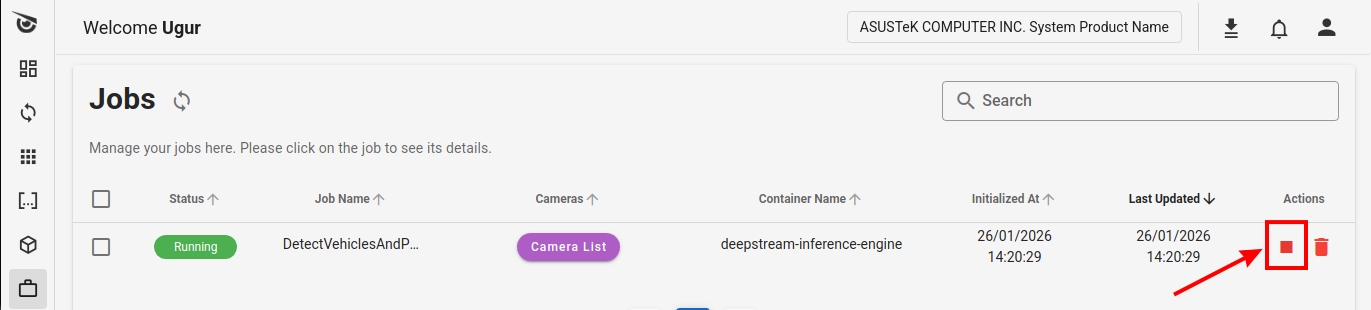
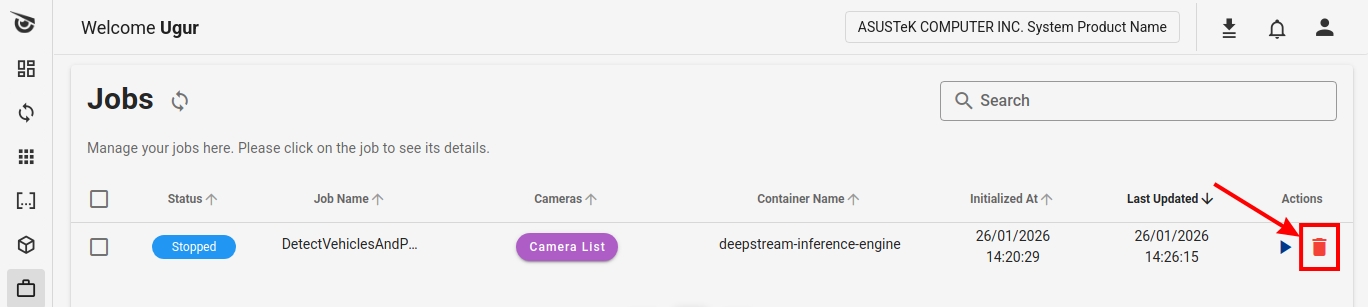
Stopping a Job
You can stop a job by clicking the Stop button under the Actions column in the Web App. Cordatus will stop the job but will not delete the job and related data. This way, you can restart the job later.
 Stopping a Job
You can also stop a job by pressing the stop button from the Client.
 Stopping a Job on Client
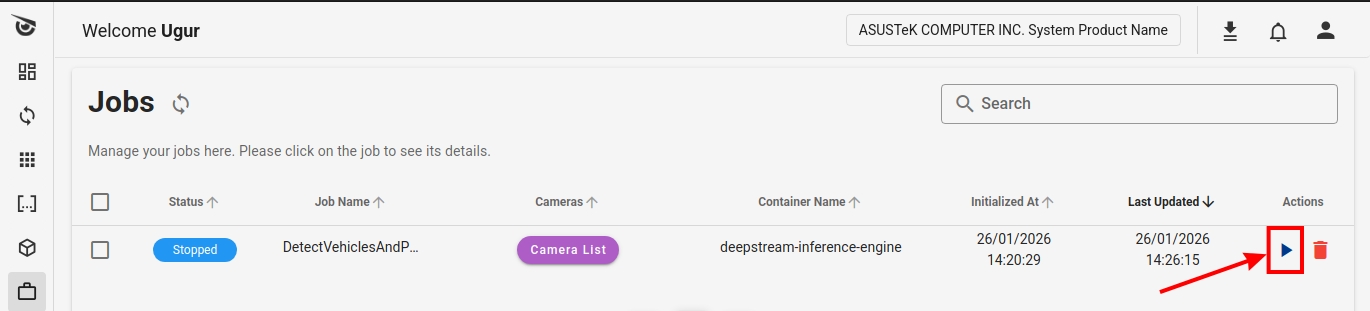
Restarting a Job
You can start a job in Stopped or Error status. For more information about job status codes, see the Job Status Codes section.
Restarting a Job on Web App
Click the Run button under the Actions column.
 Restarting a Job
Restarting a Job on Client
Click the Run button under the Actions column.
 Restarting a Job on Client
Deleting a Job
You can delete a job by clicking the Delete button under the Actions column.
 Deleting a Job
You can also delete the job on the Client by clicking the Delete button under the Actions column in the job row.
 Deleting a Job on Client
WARNING: This operation permanently deletes the job and all associated inference analytics data from the client device. This action cannot be undone once deleted. Deleting the job has no effect on the deployed model or pipeline.
Job Status Codes
Cordatus assigns various statuses to jobs throughout their lifecycles. These status codes provide information about whether the job is running as expected. Status codes are displayed in the first column of the job row labeled "Status".
| Status | Description |
|---|---|
| Downloading Model | Model is being downloaded to the device. Occurs during first deployment. |
| Building | Occurs only during the first startup of the model. Inference engine is building the model or pipeline. |
| Preparing Engine | Pipeline is set up and engine is starting. |
| Warming Up | Engine is ready, pipeline is being prepared and connecting to cameras. |
| Running | Job is running as expected. |
| Stopped | User manually stopped the job. |
| Error | An error occurred during job execution. See the troubleshooting section for possible issues. |
 Status Codes
Pipeline Profiler
Every running job ships with a built-in Pipeline Profiler that continuously measures the health and performance of the DeepStream pipeline. It attaches lightweight probes to every key stage of the pipeline (batch formation, inference, tracker, OSD, frame capture, sink, …) and reports per-stage latency, batch utilisation, per-source throughput, frame-drop ratio and active camera state.
The profiler is enabled by default and refreshes its metrics every 2 seconds, so it can be used for live troubleshooting without having to restart the job.
NOTE: The profiler is intentionally lightweight and only measures wall-clock timing on existing GStreamer pads — it does not introduce additional GPU work and has no measurable impact on inference throughput.
Accessing the Profiler
The profiler is exposed by the inference engine over the job's local API. The interactive dashboard is the recommended way to inspect a running job.
| Endpoint | Type | Description |
|---|---|---|
/dashboard | HTML | Interactive web dashboard with KPIs, charts, per-source tiles and a camera timeline. |
/profiler/json | JSON | Structured profiler snapshot (consumed by the dashboard, also useful for scripting). |
/profiler | Plaintext | Human-readable text report — handy for quick curl inspection or log capture. |
You can open the dashboard either by navigating directly to the engine's /dashboard URL on the device running the job, or by opening it from the job's context menu in the Client.
PLACEHOLDER (image): Screenshot of the Client menu/button used to open the profiler dashboard for a running job (e.g. the
dashboard_menu.pngentry).
Dashboard Overview
The dashboard is split into four areas: a job info bar, KPI cards, time-series charts and detailed tables.
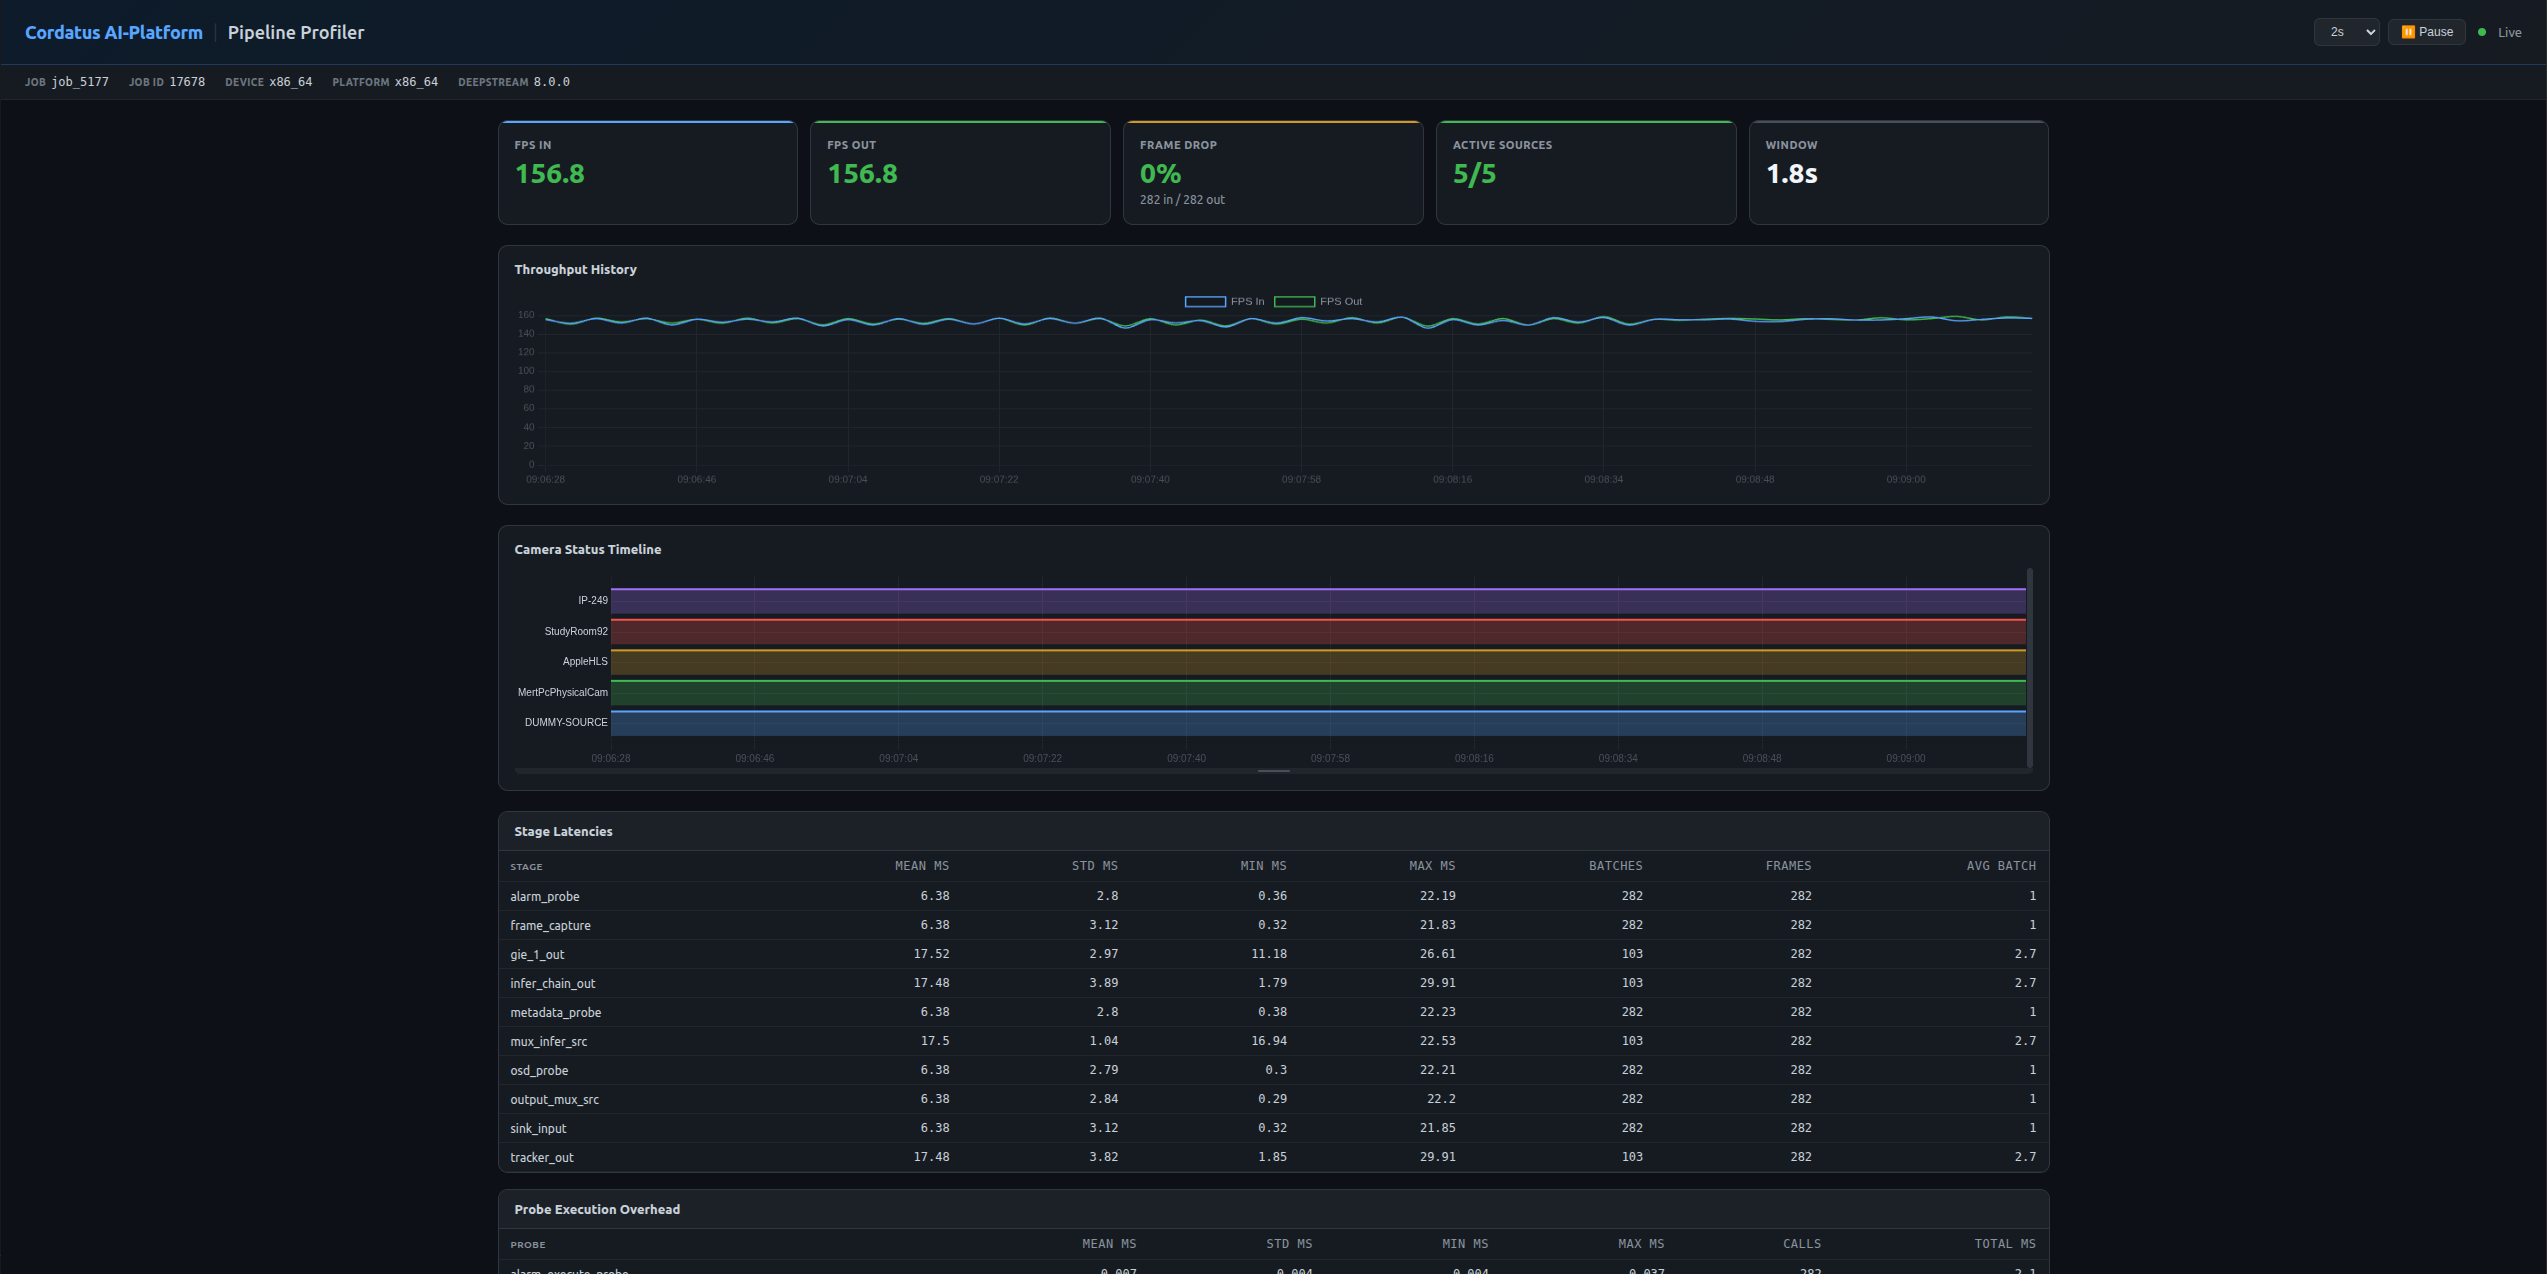
Job Info Bar
The top bar identifies which job the profiler is currently observing. It includes the Job Name, Child Job ID, Parent Job ID, Device Label, Platform and the DeepStream version in use. Use this to confirm you are looking at the correct job, especially when multiple jobs are running on the same device.
KPI Cards
The KPI row provides an at-a-glance summary of the pipeline's current health:
| KPI | Description |
|---|---|
| FPS In | Frames per second arriving at the inference batch (sum across all sources). |
| FPS Out | Frames per second leaving the pipeline at the final capture stage. |
| Frame Drop | Percentage of frames dropped between the input and output stages of the pipeline. |
| Active Sources | Number of sources that delivered at least one frame in the current measurement window. |
| Window | Length (in seconds) of the current measurement window. Counters reset at the end of each window. |

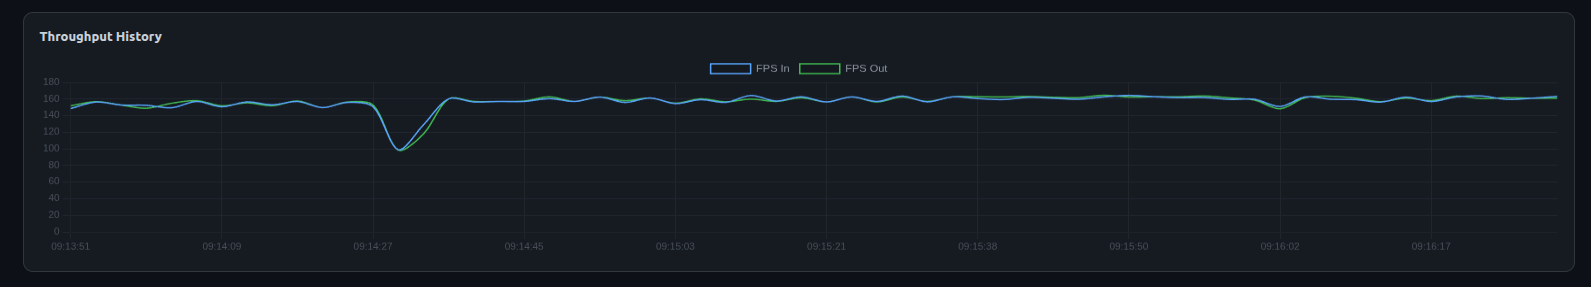
Throughput History
A live chart plots FPS In and FPS Out over time. A persistent gap between the two lines indicates frames are being dropped somewhere inside the pipeline — typically a sign of an overloaded GPU or a slow downstream stage.
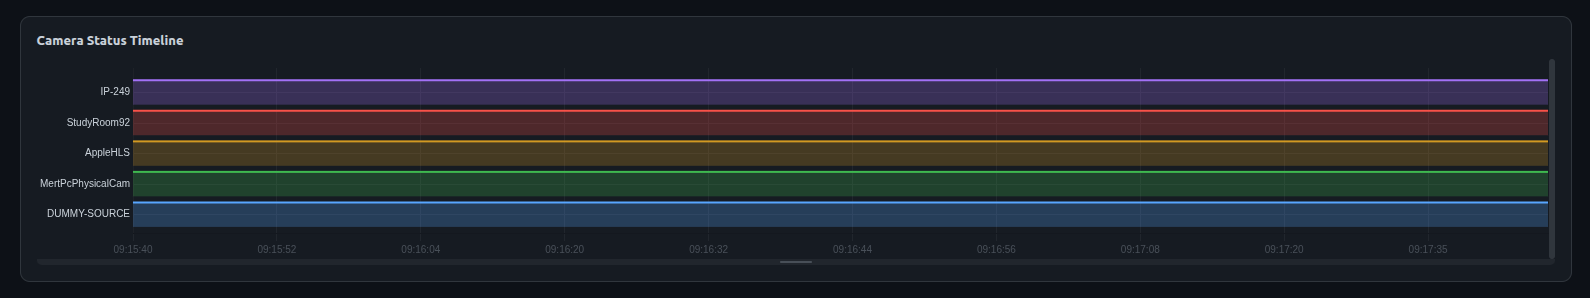
Camera Status Timeline
Each registered camera is rendered as its own row in the timeline, color-coded by state (PLAYING, PENDING, FAILED, DEAD, …) so you can immediately spot intermittent disconnects, retry storms or sources that never came online. The panel is scrollable and resizable to accommodate jobs with many cameras.
Detailed Tables
Below the charts the dashboard exposes the underlying raw metrics:
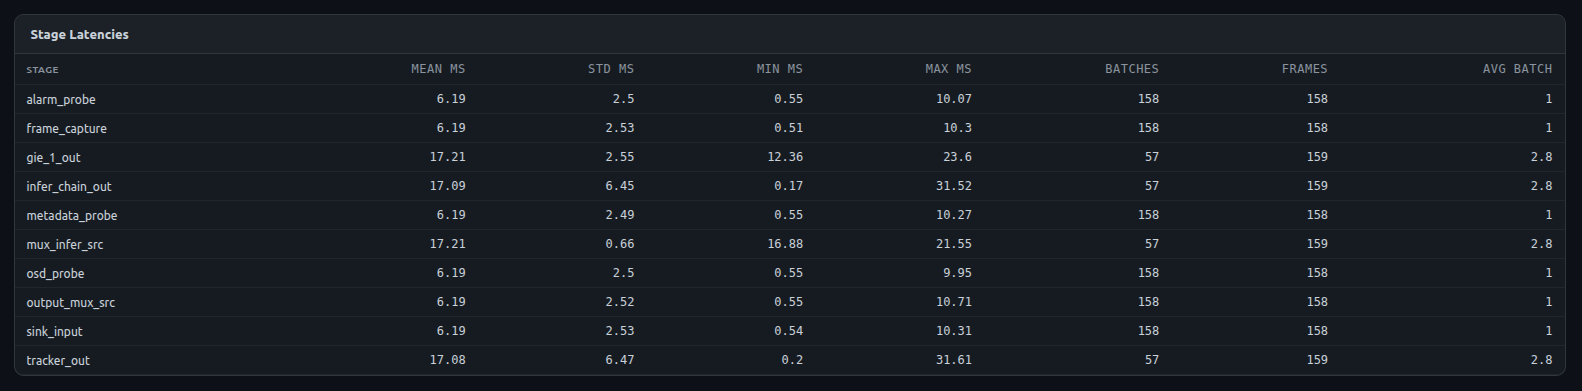
Stage Latencies
For every probed stage of the pipeline (e.g. mux_infer_src, infer_chain_out, gie_*_out, tracker_out, osd_probe, frame_capture, …) the profiler reports:
- Mean / Std / Min / Max inter-buffer arrival time in milliseconds
- Number of batches and frames processed
- Average batch size
Use this table to pinpoint which stage is the slowest contributor to overall latency. A spike in gie_*_out mean latency, for example, points at the inference engine itself, while a spike in frame_capture typically points at the encoder/sink.
Per-Source Throughput
Each source is listed individually with its frame count, current FPS, and the mean / min / max inter-frame arrival time in milliseconds. This view is particularly useful when one specific camera is dragging down the overall pipeline.

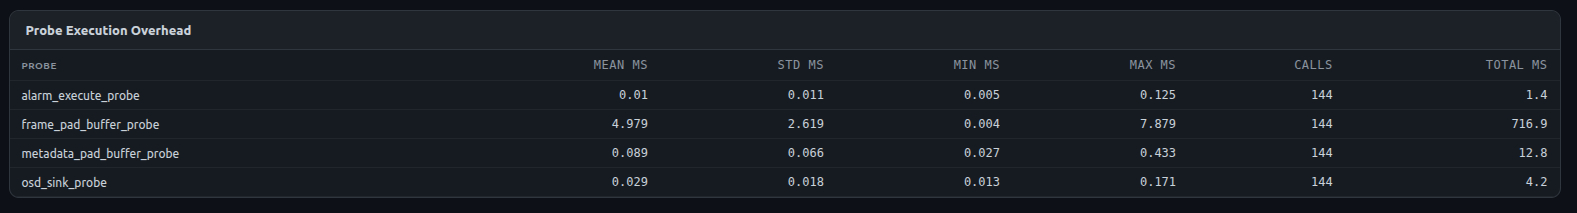
Probe Execution Overhead
Cordatus wraps its own pad probes (metadata extraction, alarm evaluation, OSD drawing, frame capture, …) so the profiler can measure how much CPU time each callback consumes. The table shows mean / std / min / max execution time per call, total call count, and total wall-clock time spent in the callback. If a custom probe is starving the pipeline, it will surface here.
Active Cameras
A detailed view of every registered source: source ID, name, GStreamer state, timeout / max-timeout counter, drop / max-retry counter, retry interval and the source URL. Cameras that received a frame in the current window are flagged as alive. This is the single most useful table when diagnosing dropped or reconnecting cameras.
Dashboard Controls
The dashboard header exposes two controls:
- Refresh interval selector — switch the polling interval between 1 s, 2 s, 5 s and 10 s. Lower values give a more responsive dashboard at the cost of slightly more network traffic.
- Pause / Resume button — temporarily freezes the dashboard so you can inspect a snapshot in detail without it being overwritten by the next poll.

Using the Profiler for Troubleshooting
The profiler is most useful when something looks wrong with a job. A few common patterns:
- Output FPS lower than input FPS, growing Frame Drop % — the pipeline cannot keep up. Check the Stage Latencies table for the slowest stage, then move down to Per-Source Throughput to see whether the load is uneven across cameras.
- One camera marked as dropped or with a growing retry counter — check the Active Cameras table for the affected source ID. The retry interval and drop max-retry values shown here are the same ones used by the engine's reconnect logic.
- High mean execution time on a probe — typically points at a custom alarm or analytics callback. The Probe Execution Overhead table will show which one.
- Per-source inter-frame ms much higher than expected — the camera itself is delivering frames slowly (network or codec issue), not the inference pipeline.
Using Interface
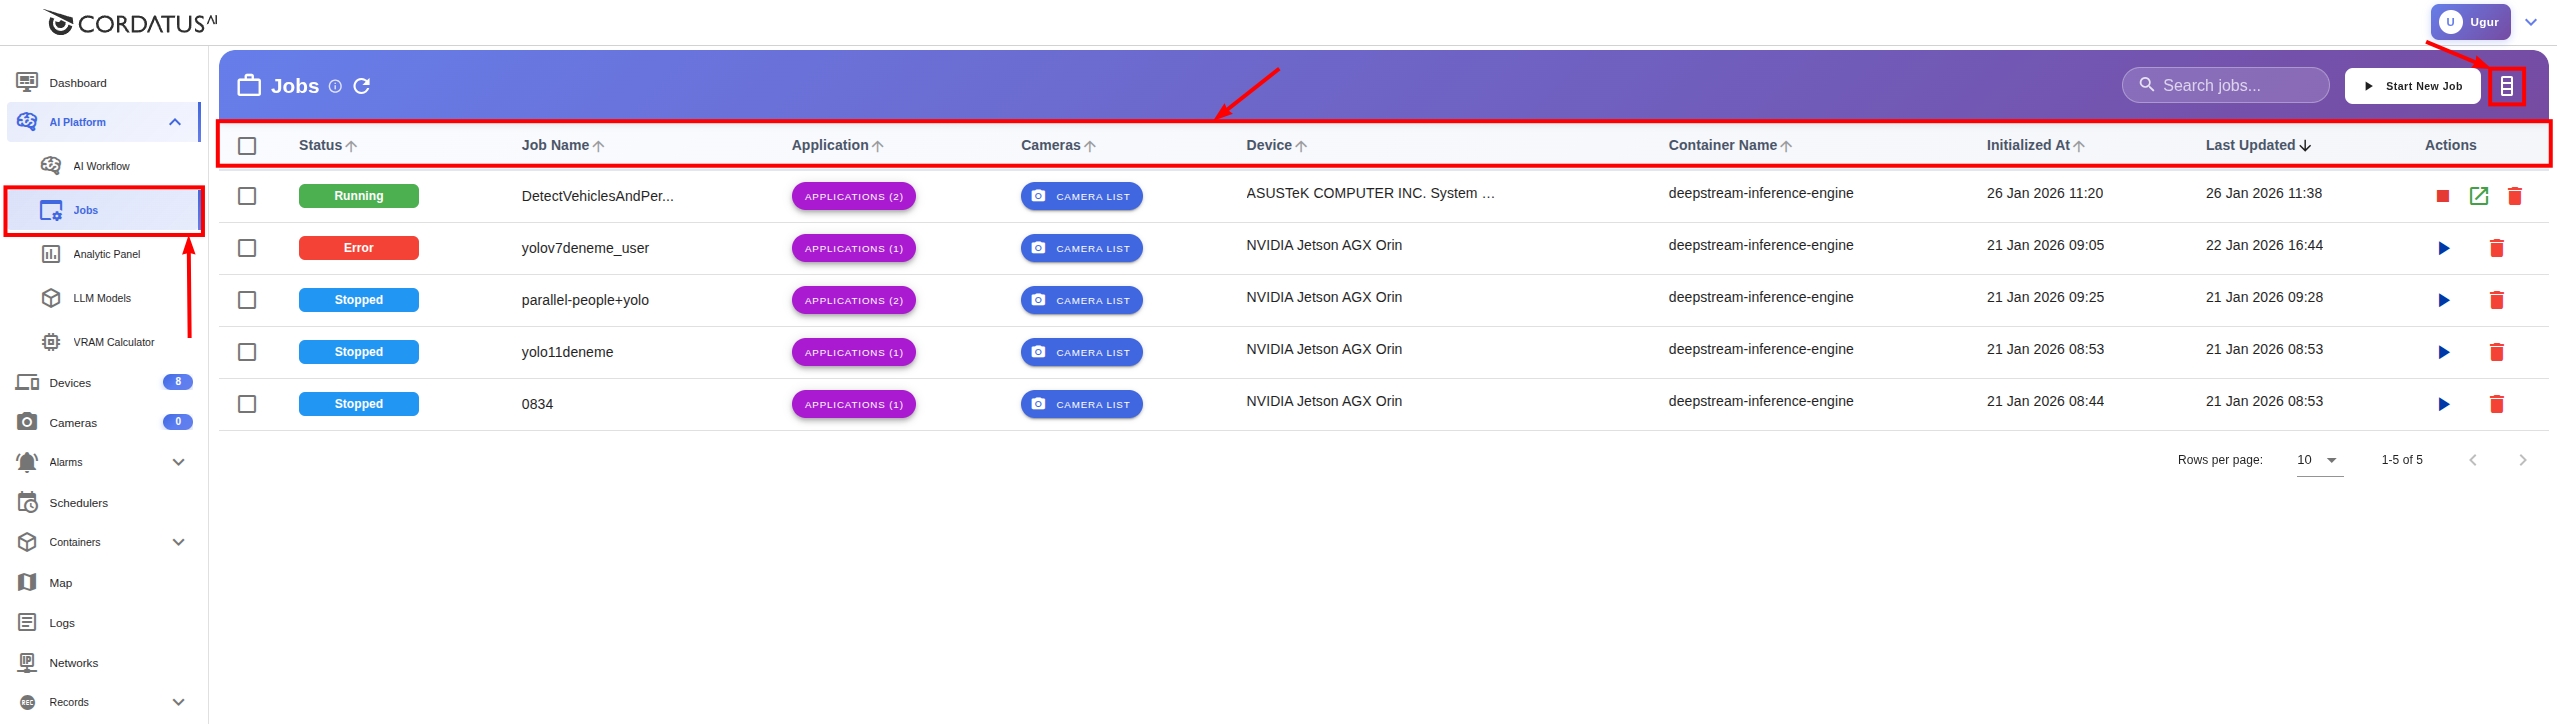
The Jobs page offers user-friendly features to improve the overall experience.
Job Information
On this page, you can access detailed information about your jobs: You can use the edit button in the upper right to open and close columns.
- Status: Current state of the job
- Job Name: Name of the job
- Applications: Model(s) used
- Cameras: Connected cameras
- Device: Device running the job
- Container Name: Inference engine used
- Initialized At: Start time
- Last Updated: Update time
 Jobs Page
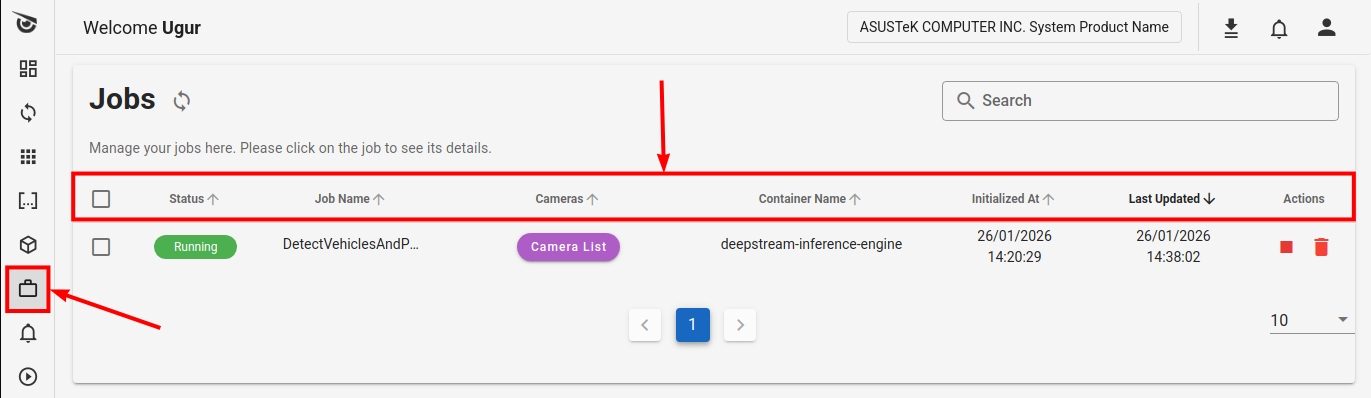
You can use the same features on the Client (except device name, because you're already viewing that device's jobs).
 Jobs Page on Client
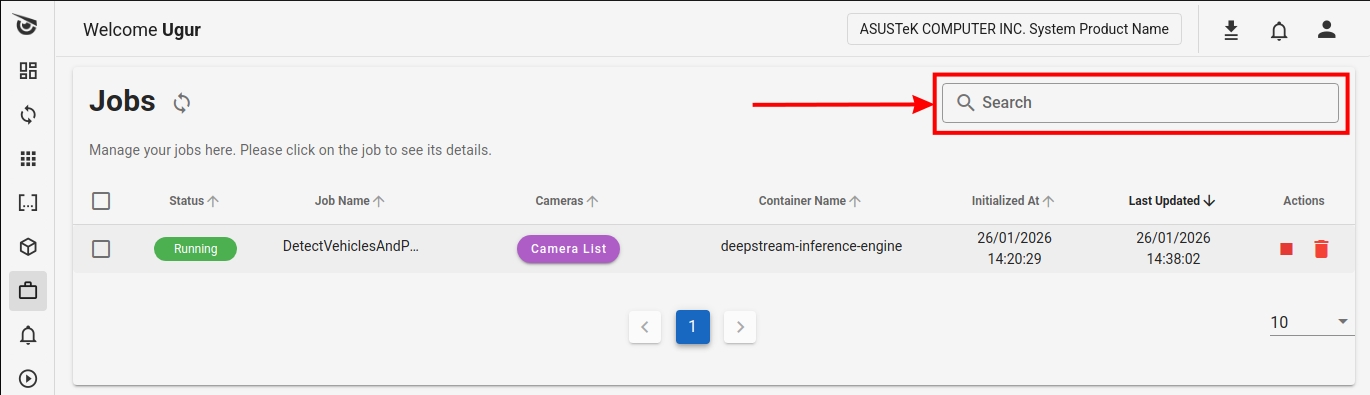
Search Feature
You can easily find specific jobs by entering the job name using the search box in the upper right corner of the screen.

The same search box is also available on the Client.
Sorting
You can sort your jobs by relevant column data by clicking column headers. This feature is available on both the Client and Web App.
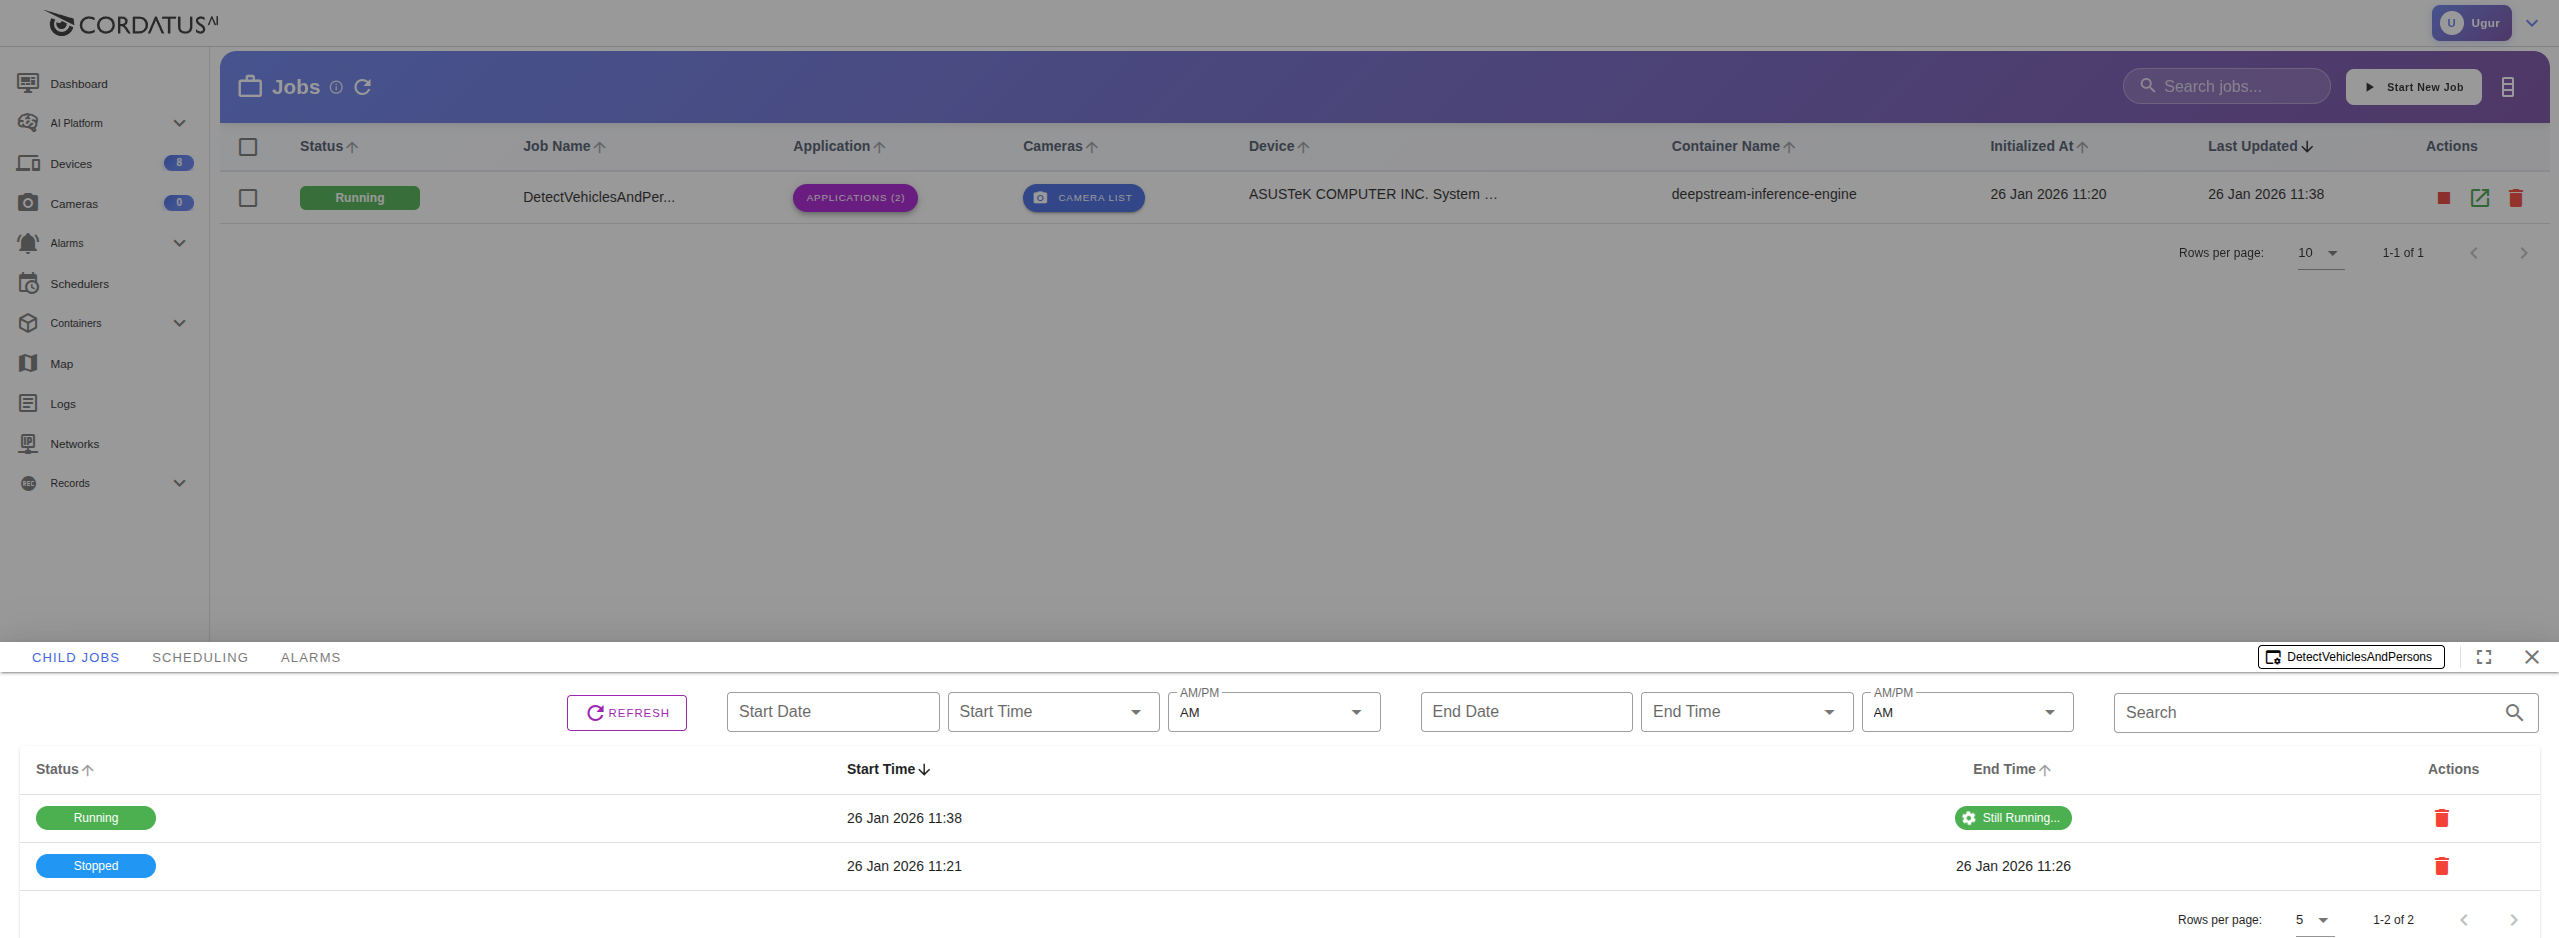
Child Jobs
When you click on a job in the Web App, a new modal opens at the bottom of the page displaying child jobs associated with the selected job. In this modal:
- You can review the job history (how many times the job was started)
- You can get information about child jobs (their statuses, start and end times)
- You can delete child jobs by clicking the delete icon under the Actions column
 Child Jobs on Web App
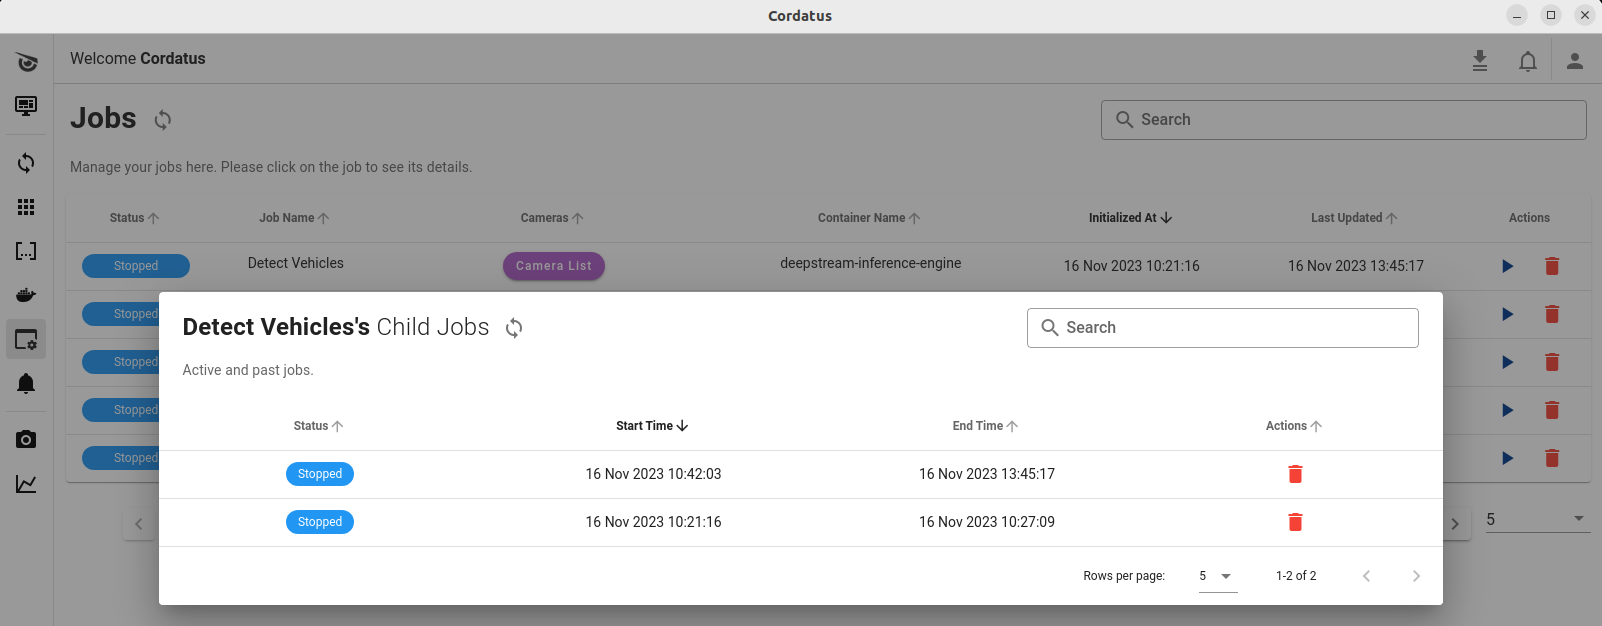
When you click on a job on the Client, the same modal opens in the center of the screen with the same functionalities.
 Child Jobs on Client
Version Support
| Platform | OS / L4T | JetPack | AGX Thor | AGX Orin Industrial | AGX Orin | Orin NX | Orin Nano | Xavier Series | TX2 Series |
|---|---|---|---|---|---|---|---|---|---|
| ARM64 (Jetson) | L4T 38.2 | JetPack 7.0 | ✔️ | ❌ | ❌ | ❌ | ❌ | ❌ | ❌ |
| ARM64 (Jetson) | L4T 36.4.4 | JetPack 6.2.1 | ❌ | ✔️ | ✔️ | ✔️ | ✔️ | ❌ | ❌ |
| ARM64 (Jetson) | L4T 36.2 | JetPack 6.0 | ❌ | ✔️ | ✔️ | ✔️ | ✔️ | ❌ | ❌ |
| ARM64 (Jetson) | L4T 35.6.2 | JetPack 5.1.5 | ❌ | ✔️ | ✔️ | ✔️ | ✔️ | ✔️ | ❌ |
| ARM64 (Jetson) | L4T 35.4.1 | JetPack 5.1.2 | ❌ | ✔️ | ✔️ | ✔️ | ✔️ | ✔️ | ❌ |
| ARM64 (Jetson) | L4T 35.3.1 | JetPack 5.1.1 | ❌ | ✔️ | ❌ | ✔️ | ✔️ | ✔️ | ❌ |
| ARM64 (Jetson) | L4T 35.2.1 | JetPack 5.1 | ❌ | ✔️ (32GB) | ❌ | ✔️ (16GB) | ❌ | ✔️ | ❌ |
| ARM64 (Jetson) | L4T 35.1 | JetPack 5.0.2 | ❌ | ✔️ (32GB) | ❌ | ❌ | ❌ | ✔️ | ❌ |
| ARM64 (Jetson) | L4T 32.7.6 | JetPack 4.6.6 | ❌ | ❌ | ❌ | ❌ | ❌ | ✔️ | ✔️ |
| ARM64 (Jetson) | L4T 32.7.1 | JetPack 4.6.1 | ❌ | ❌ | ❌ | ❌ | ❌ | ✔️ | ✔️ |
| x86_64 | Ubuntu 22.04 | — | — | — | — | — | — | — | — |
| x86_64 | Ubuntu 24.04 | — | — | — | — | — | — | — | — |
For detailed information about the DeepStream version installed on your device, you can visit the NVIDIA DeepStream SDK page.
Copyright © 2025 Cordatus.