Analytics Rules
Cordatus offers powerful inference analytics capabilities. Beyond object detection and classification, Cordatus easily analyzes and detects object behaviors.
You can create the following analytics rules on the Stream Details screen:
- Line Crossing Detection: Detection of crossing lines
- ROI Filtering: Region of interest filtering
- Direction Detection: Direction of movement detection
- Entry & Exit Detection: Detection of entry and exit
Bounding Box Coloring
By default, bounding boxes of detected objects during inference are displayed in red. However, when a detected object triggers an analytics rule, the bounding box color changes to blue.
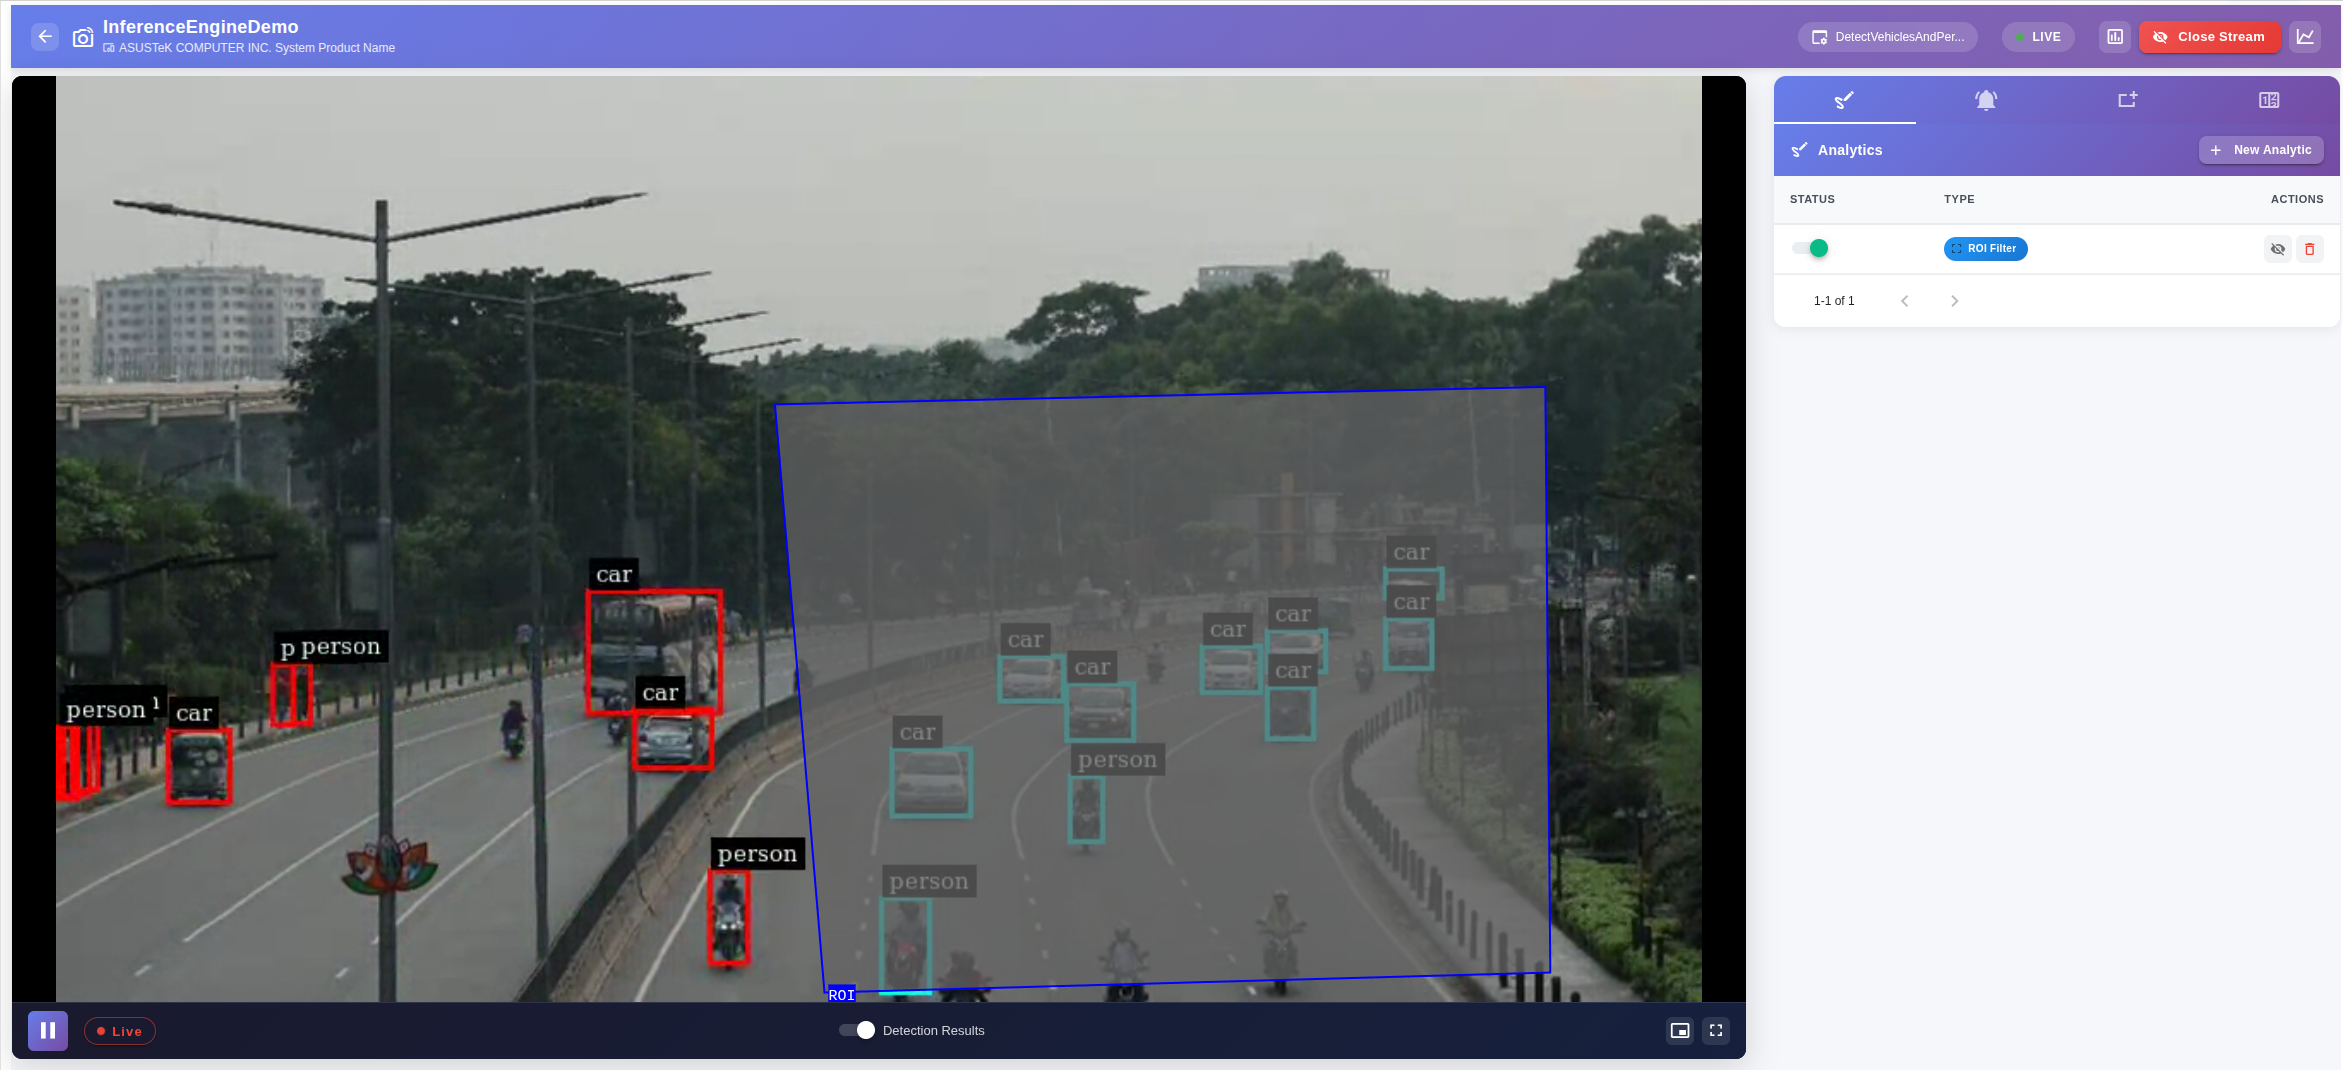
Conditions when bounding boxes turn blue:
- ROI Filtering: The bounding box is displayed in blue as long as the object remains within the ROI.
- Line Crossing: The bounding box is displayed in blue at the moment the object crosses the line.
- Direction Detection: The bounding box is displayed in blue at the moment the object moves in the specified direction.
This visual feedback makes it easy to track in real-time which objects are triggering analytics rules.
Line Crossing
This rule validates whether an object crosses a pre-configured virtual line in a specific direction and cumulatively counts the number of crossing events.
To add a line crossing rule:
- Click the New Analytic button on the right side to open the Add Analytic modal.
- Select Line Crossing as the Analytic Type.
- (Optional) Edit the Advanced Settings:
- Mode: Choose loose, strict, or balanced to determine crossing criteria.
- Enter a name for the rule in the Label field.
- Use Draw Analytic in two steps:
- i. Click on the line edges to define the crossing area.
- ii. Draw the direction for crossing detection.
- Click Check to save the rule or eraser to delete it.
- Repeat steps 4 through 6 to add an additional rule.
- Click Save Without Alarm (see the Alarms section to set up an alarm).
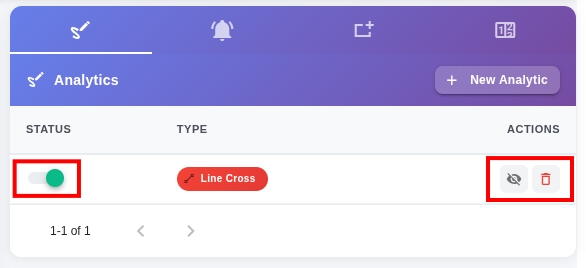
From the menu on the right, you can stop and restart the inference using the toggle switch. Use the eye icon to change the rule's visibility on the screen, and the trash icon to delete it.
Line Crossing Options
ROI Filtering
This rule identifies the presence of objects within a specified ROI area and cumulatively counts the number of object occurrences in that area.
To add an ROI filtering rule:
- Click the New Analytic button on the right side to open the Add Analytic modal.
- Select ROI Filtering as the Analytic Type.
- (Optional) Edit the Advanced Settings:
- Inverse ROI: Enable to count objects outside the specified ROI area.
- Enter a name for the rule in the Label field.
- Use Draw Analytic by drawing a polygon in the desired area.
- Click Check to save the rule or eraser to delete it.
- Repeat steps 4 through 6 to add an additional rule.
- Click Save Without Alarm (see the Alarms section to set up an alarm).
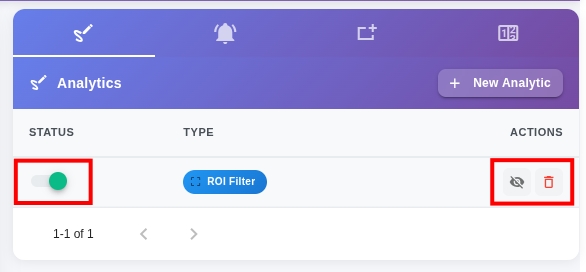
From the menu on the right, you can stop and restart the inference using the toggle switch. Use the eye icon to change the rule's visibility on the screen, and the trash icon to delete it.
ROI Filtering Options
Direction Detection
This rule checks whether an object follows a predefined direction based on its position history and current frame information. The direction detection rule also cumulatively counts objects moving in this specific direction.
To add a direction detection rule:
- Click the New Analytic button on the right side to open the Add Analytic modal.
- Select Direction Detection as the Analytic Type.
- (Optional) Advanced Settings:
- Mode: This parameter determines the operating mode. The loose selection checks whether the object crosses the line and only needs to be in the same direction with very high tolerance. Modes can be selected as loose, strict, and balanced.
- Write the name of the rule in the Label field.
- Draw an arrow indicating the direction you want to analyze. First, click on the map for the back of the arrow, and second, click for the tip of the arrow.
- Click the Check button to save the rule.
- Repeat steps 4 through 6 to add an additional rule.
- Click Save Without Alarm. Please check the Alarms section to learn how to set up an alarm.
NOTE: The direction detection rule is applied to all objects in the frame moving in the direction you drew, not just those intersecting with the arrow.
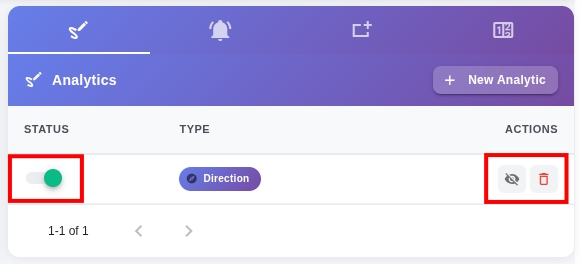
From the menu on the right, you can stop and restart the inference using the toggle switch. Use the eye icon to change the rule's visibility on the screen, and the trash icon to delete it.
 Direction Detection Options
Entry & Exit Detection
This rule checks and counts the entry and exit actions of detected objects relative to the drawn lines. The Entry & Exit Detection rule also cumulatively calculates the number of entering objects, exiting objects, and the difference between them.
To add a counter rule:
- Click the New Analytic button on the right side to open the Add Analytic modal.
- Select Counter as the Analytic Type.
- Group: A collection of entry and exit lines.
- Write the name of the rule in the Group Label and click the Add Group button.
- Draw Analytic: Draw the entry and exit directions.
- Write a name in the Label for entry.
- Select the Group Name created in step 3.
- Select Enter as the Type for entry.
- Draw the entry arrows.
- Click the Check button and save the entry drawing.
- Now create a drawing for exit.
- Write a name in the Label for exit.
- Select the Group Name created in step 3.
- Select Exit as the Type for exit.
- Draw the exit arrows.
- Click the Check button and save the exit drawing.
- You can draw as many entry and exit lines as you need by repeating the above steps.
- Click the Save Counter button. The rule will be saved and the modal will close.
From the menu on the right, you can stop and restart the inference using the toggle switch. Use the eye icon to change the rule's visibility on the screen, and the trash icon to delete it.
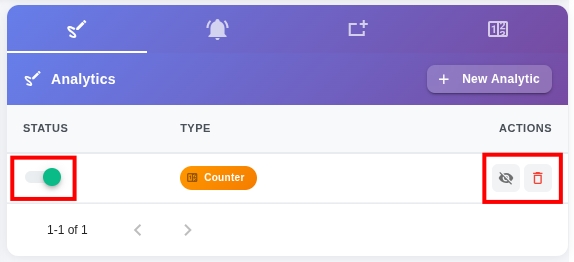
Smart Counter Options
Counters
Cordatus allows you to view analytics results in real-time while watching the live stream with the Counter feature. This means you can display results as numbers instead of complex charts. It's like having the numbers explained to you right there, making it easier to understand why they are calculated that way.
You can create a counter for each previously described analytics rule. To add a counter to your screen, follow these steps:
- Click the Counters icon in the upper right corner of the screen.
- Click the + Counter icon to open the New Counter modal.
- Select Analytic: Select the Analytic Rule you want to add a counter for.
- Select Class: Select the object type you want to count.
- Counting Type: Select Cumulative for cumulative counts, Current for counts only while events are occurring.
- Click Save and Start Count to apply the changes.
INFO: As the name suggests, cumulative count type counts objects or events from the moment the rule was created until now. In contrast, current count type only provides counting during ongoing events. For example, for ROI Filtering, cumulative count includes the count of all objects detected in that ROI since the rule was initiated. On the other hand, current count type shows the counts of objects currently detected in the ROI.
After creating the counter, it will appear in the counters window on the right. It lists active counters with details such as the associated analytics rule, analytics results, counter type, and additional information. You can add as many counters as you want to your running job.
Analytics Dashboards & Collections
Analytics Dashboards provide customizable data views for inference analytics. Dashboard Collections are custom dashboard collections linked to models or pipelines.
Creating a Dashboard Collection
Before creating analytics dashboards, we need to set up a Dashboard Collection. This is a group of dashboards for a specific model or pipeline.
To create a dashboard collection, follow these steps:
- Go to the Dashboard Collections page.
- Click the New Dashboard Collection button.
- Collection Name: Give your collection a name.
- Application: Select a model or pipeline for analytics. Each collection is dedicated to a single model or pipeline.
- Click Save Collection.
Your dashboard collection is now created.
Creating a Dashboard
A dashboard consists of various visual charts to present inference analytics. Each dashboard can host multiple charts.
To create a dashboard, follow these steps:
- Click on the dashboard collection you want to add a dashboard to.
- Click the New Dashboard button. The New Dashboard modal will open.
- Dashboard Name: Give your dashboard a name.
- Click Save Dashboard.
Your dashboard is now set up and ready to add charts.
Charts
Charts are powerful tools for visualizing inference analytics. They provide a clear and easily understandable format for understanding the distribution of your inference results. This enables you to identify patterns and trends to make informed decisions.
Cordatus currently supports four different chart types:
- Distribution Charts: Distribution graphs
- Time-Based Charts: Time-based graphs
- Counter Charts: Counter graphs
- Entry-Exit Charts: Entry-exit graphs
NOTE: Ensure at least one job is actively running and displaying data on charts. Without a running job, charts will remain empty.
When you start a job, Cordatus automatically detects objects on the stream and records relevant information. You don't need to take an additional step to view Distribution and Time-Based charts. However, to view Counter and Entry-Exit Charts, you must configure analytics rules as described in the relevant sections.
Distribution Chart
Cordatus allows you to create pie charts for inference analytics, providing a visual representation of the distribution of your inference results.
To add a Distribution Chart to your dashboard:
- Go to the Dashboard page.
- Click the Edit Layout button. This action allows you to edit existing charts and makes layout grids visible.
- Select Add New Chart. This action opens the Add New Chart modal.
- Chart Name: Give your chart a name; it will be displayed as a title at the top of the chart.
- Chart Type: Select Distribution.
- Select a model to visualize inference results.
- Click Save on the modal.
- Finally, click Save Changes in the upper right corner of the page.
Time-Based Chart
Cordatus offers a time-based chart feature. It can divide time into equal intervals and count the objects detected within these periods. This feature provides valuable information about the frequency and timeline of detected objects, making it easier to track patterns and trends over time.
To add a Time-Based Chart to your dashboard:
- Go to the Dashboard page.
- Click the Edit Layout button. This action allows you to edit existing charts and makes layout grids visible.
- Select Add New Chart. This action opens the Add New Chart modal.
- Chart Name: Give your chart a name; it will be displayed as a title at the top of the chart.
- Chart Type: Select Time Based.
- Select a model to visualize inference results.
- Click the Group By menu and select a time interval from the dropdown menu to set the duration of your intervals.
- Click Save on the modal.
- Finally, click Save Changes in the upper right corner of the page.
You can customize the chart using the options at the top of the chart:
- Change the bars representing the number of detected objects by clicking the colored buttons.
- Switch between bar chart and line chart with the buttons in the upper right.
- Choose between stacked and tiled visuals with the Stack icon.
- Download the chart as an image using the download icon.
- Zoom in and reset zoom using the relevant icons in the upper right:
- Click the Zoom icon and select the desired time frame by clicking on the first bar and dragging the cursor to the last bar you want to display on the chart.
- Click the Zoom Reset icon to reset the zoom.
- Limit the number of intervals on the chart by sliding the edges of the bottom slider.
Counter Chart
Counter charts are associated with analytics rules and display the detection results of these rules set by users. They specifically count situations where analytics rules are triggered. To use counter charts, you must have an active analytics rule for the job. See the analytics rules section for more details on setting up analytics rules.
To add a counter chart to your dashboard:
- Go to the Dashboard page.
- Click the Edit Layout button. This action allows you to edit existing charts and makes layout grids visible.
- Select Add New Chart. This action opens the Add New Chart modal.
- Chart Name: Give your chart a name; it will be displayed as a title at the top of the chart.
- Chart Type: Select Counter.
- Analytic Type: Select an analytics rule to visualize inference results.
- Click the Group By menu and select a time interval from the dropdown menu to set the duration of your intervals.
- Click Save on the modal.
- Finally, click Save Changes in the upper right corner of the page.
You can customize the chart using the options at the top of the chart:
- Change rules representing different sub-rules (for example, two lines in a line crossing rule) by clicking the colored icons at the top.
- Switch between bar chart and line chart with the buttons in the upper right.
- Choose between stacked and tiled visuals with the Stack icon.
- Download the chart as an image using the download icon.
- Zoom in and reset zoom using the relevant icons in the upper right:
- Click the Zoom icon and select the desired time frame by clicking on the first bar and dragging the cursor to the last bar you want to display on the chart.
- Click the Zoom Reset icon to reset the zoom.
Entry-Exit Charts
Similar to counter charts, Entry & Exit charts are also associated with the Entry & Exit Detection Analytics rule. They visualize entries and exits to a specified area and show the difference between these values over time. To use Entry & Exit charts, you must have an active Entry & Exit Detection Analytics rule for the job. See the analytics rules section for detailed information on setting up Entry & Exit Detection Rules.
To add an entry-exit chart to your dashboard:
- Go to the Dashboard page.
- Click the Edit Layout button. This action allows you to edit existing charts and makes layout grids visible.
- Select Add New Chart. This action opens the Add New Chart modal.
- Chart Name: Give your chart a name; it will be displayed as a title at the top of the chart.
- Chart Type: Select Smart Counter (Entry-Exit).
- Select Job: Select the Job you want to create a chart for.
- Click the Group By menu and select a time interval from the dropdown menu to set the duration of your intervals.
- Select Group: Select the Group you created during analytics rule creation.
- Class Label: Select the object type you want to count.
- Click Save on the modal.
- Finally, click Save Changes in the upper right corner of the page.
You can customize the chart using the options at the top of the chart:
- Change the lines representing entry, exit, and difference counts by clicking the colored icons at the top.
- Switch between bar chart and line chart with the buttons in the upper right.
- Choose between stacked and tiled visuals with the Stack icon.
- Download the chart as an image using the download icon.
- Zoom in and reset zoom using the relevant icons in the upper right:
- Click the Zoom icon and select the desired time frame by clicking on the first bar and dragging the cursor to the last bar you want to display on the chart.
- Click the Zoom Reset icon to reset the zoom.
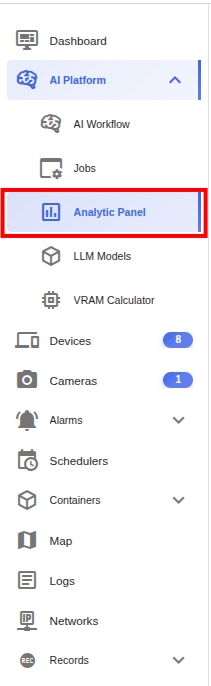
Dashboard Page and Editing Charts
You can view charts for all jobs in a Dashboard, provided the models used by those jobs are compatible with the Dashboard type. To select a different job and view its analytics, use the dropdown menu labeled Inference Job in the upper left corner. You can also click the Select Time field to select a specific time frame and view analytics results for that period. After selecting the desired job and time frame, click the refresh button in the upper right corner to display the selected analytics results.
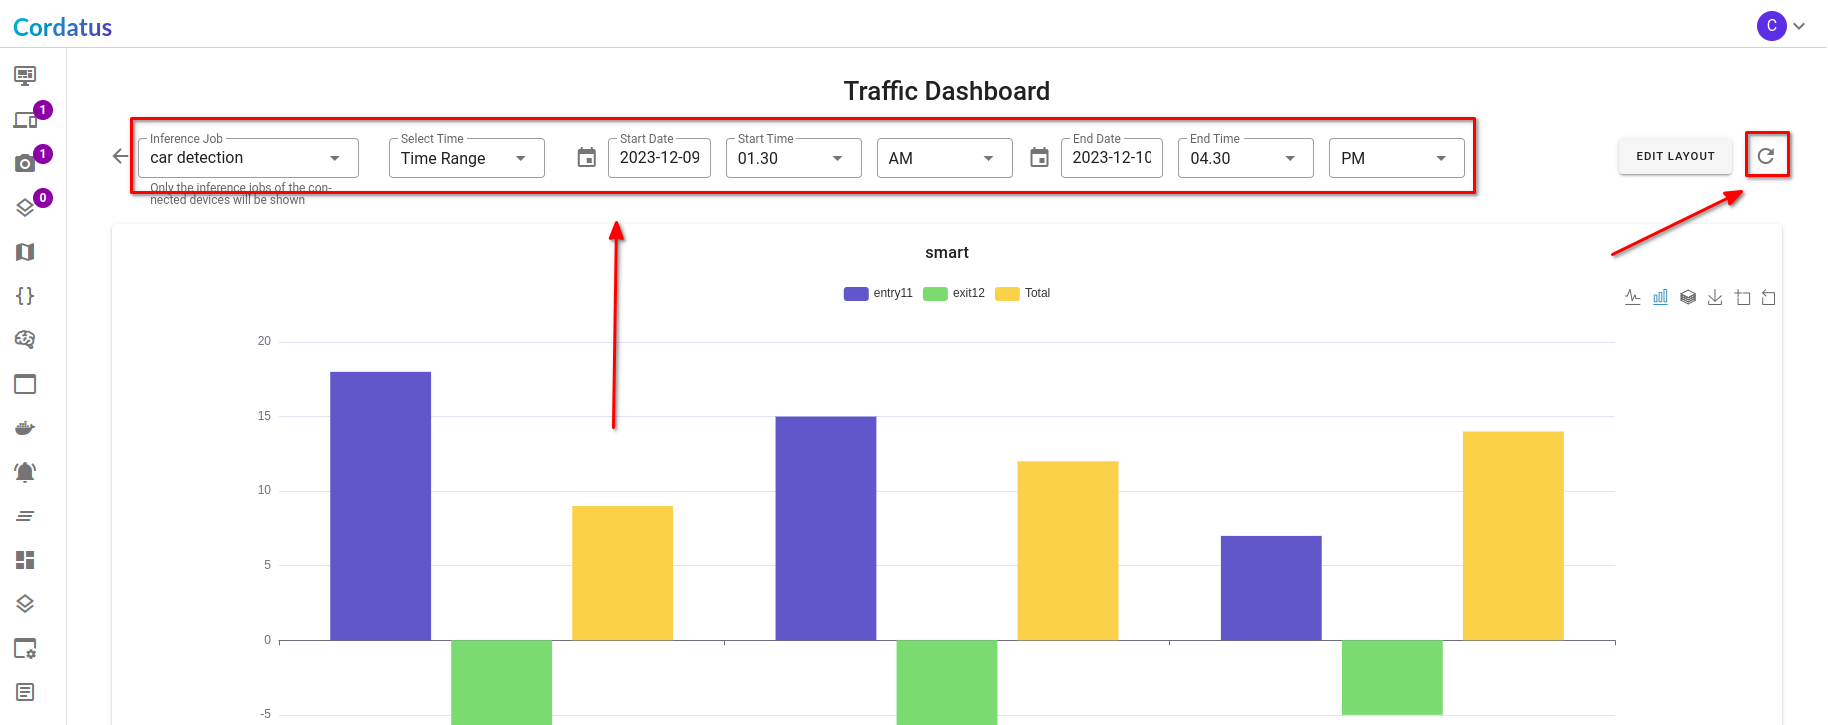 Dashboard Menu
You can further customize the charts on the dashboard page by entering edit mode through the Edit Layout button in the upper right corner. In edit mode, you can:
- Adjust the size of charts using the arrow icon in the lower right corner.
- Rearrange the positions of charts by dragging and dropping.
- Remove a chart by clicking the X icon in the upper right corner.
After you finish editing, click the Save Changes button in the upper right corner of the screen to save your changes.
Copyright © 2025 Cordatus.